- ESA’s October event focused on processing, comparison and access to Biomass-related data.
- Radar observations and estimates of forest biomass are different layers of information.
- Reproducible software and independent validation are essential to making satellite products trustworthy.
The recent event and its significance
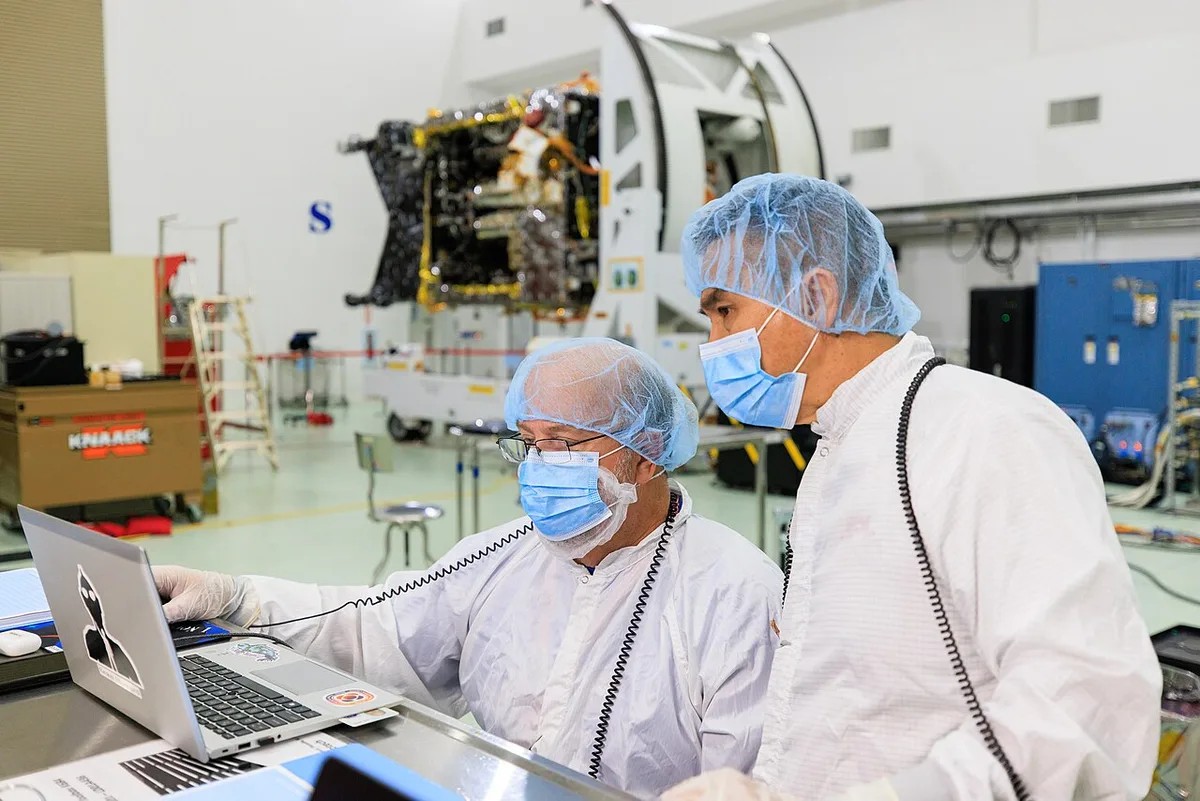
ESA’s 2026 Biomass MAAP Hackathon was scheduled for October 12–16 at ESOC, with an agenda centered on data processing, visualization and comparison with other measurements. Its published program describes work involving the MAAP platform and BioPAL software. The program is evidence of planned technical collaboration, not a report that every proposed processing task was completed. It is nevertheless a revealing view of what follows the development of an advanced Earth-observation instrument: software, reference data and practical access still require sustained engineering.
The satellite’s measurement capability is only one part of the pathway to a forest map that researchers can interpret. The workshop’s focus illustrates why scientific infrastructure includes code and documentation as well as hardware in orbit.
Radar does not produce an ordinary photograph
A radar sends electromagnetic energy and measures the returned signal. Its observations depend on the properties and arrangement of the things the signal encounters. An image assembled from those observations can therefore reveal information that differs from the appearance of a scene in visible light.
Synthetic aperture processing combines measurements collected as the platform moves. The resulting product depends on careful treatment of geometry and signal phase. This computational foundation is one reason a radar image should not be interpreted as a simple camera view with unusual colors. The processing choices help define what a pixel represents. Understanding those choices is essential when a later algorithm uses the image to estimate a physical property of the landscape.
Wavelength changes the interaction
Different radar wavelengths interact with vegetation in different ways. The relative importance of leaves, branches, trunks and ground depends on the signal and the scene. This gives researchers opportunities to study structure that is difficult to infer from surface appearance alone, but the relationship is not a universal lookup table.
A forest is a complex mixture of objects with different shapes, water content and orientations. Changes in the returned signal can have several explanations. The task is therefore to use appropriate models and supporting observations to constrain those explanations. A promising wavelength offers a useful physical interaction; it does not eliminate the need to understand the landscape or validate the resulting estimates against independent evidence.
From a radar observation to a biomass estimate
Biomass describes a biological quantity, while the radar records an electromagnetic response. Connecting the two requires an inference. Researchers use relationships between structure, material properties and reference measurements to build that connection. The assumptions and uncertainties in this step should remain visible in the final product.
This distinction matters when maps are used beyond the research group that created them. A user may see a single value at a location without realizing how much processing and modeling stands behind it. Good documentation should identify the observation period, spatial resolution and conditions under which the estimate is less reliable. A useful map helps its users avoid inappropriate comparisons, rather than merely supplying a number everywhere.
Independent comparisons expose different weaknesses
A field survey can measure selected trees or plots in detail, while a satellite provides broader coverage. Another remote-sensing instrument may respond to a different aspect of forest structure. Comparing these sources can reveal where a model performs well and where its assumptions become strained.
The comparison itself must be designed carefully. Measurements collected at different times may describe a changing forest. A small field plot may not represent the same area as a larger satellite pixel. Location uncertainty can introduce apparent disagreement near sharp boundaries. These are not reasons to avoid validation; they are reasons to describe how the comparison was aligned. Otherwise, readers cannot tell whether a mismatch comes from the satellite product or from the way the reference was used.
Open processing makes questions answerable
When processing methods are available for inspection, another researcher can examine how a result was produced. They can test an assumption, identify an implementation error or apply the method to a different region. This does not make every open result correct, but it makes correction and comparison more practical.
Reproducibility requires more than publishing a code repository. Software versions, input data, configuration and dependencies all influence the output. A notebook that runs only in its author’s environment offers limited help to an unfamiliar user. Clear examples and stable processing environments reduce that barrier. The practical quality of the software can therefore affect who is able to evaluate the science, which is a significant issue for a mission with a broad potential user community.
Visualization should reveal uncertainty
Three-dimensional forest displays can make complex measurements easier to explore. They can also suggest a level of completeness that the observations do not support. Interpolation, filtering and color choices should be distinguished from directly measured information. A beautiful display is a communication tool, not independent evidence of accuracy.
A useful visualization allows users to inspect quality indicators and trace a displayed value back to its underlying product. It should also make missing information recognizable. Showing uncertainty is not a weakness in the presentation; it helps a reader ask better questions. For example, an apparent boundary may deserve investigation if it aligns with a processing change rather than a feature of the forest.
A practical first step for a new data user is to reproduce a documented example before changing its parameters. Confirm the input version, inspect the quality layers and compare the output with the reference result. Only then apply the workflow to a new region. This approach helps separate a genuine environmental difference from a local software or configuration problem. Keeping that small reproducible example also makes it easier to ask a precise technical question when a later result is unexpected.
Why the workshop belongs in the technology story
The broader lesson of ESA’s event is that scientific usefulness emerges through a chain of contributions. An instrument collects signals, processing converts them into observations, models estimate physical quantities and validation establishes where those estimates deserve confidence. Weakness in any link can limit the whole product.
For readers following Biomass and similar missions, future announcements should therefore be assessed at the correct level. A new processing tool is not a new physical discovery, and an attractive map is not a substitute for validation. Yet improvements in access, reproducibility and comparison can make an existing instrument much more useful. The work that happens around an open software table may be less visible than a launch, but it can determine how much trustworthy knowledge the mission ultimately delivers.
Sources & further reading
Primary references inform the reporting. Our explanations, scenarios, and conclusions are editorial analysis; source statements are not independent test results.
- ESA’s 2026 Biomass MAAP Hackathoneo4society.esa.int
Source publication or reference date: 2026-10-12.
See an error or an important update? Contact the editors.